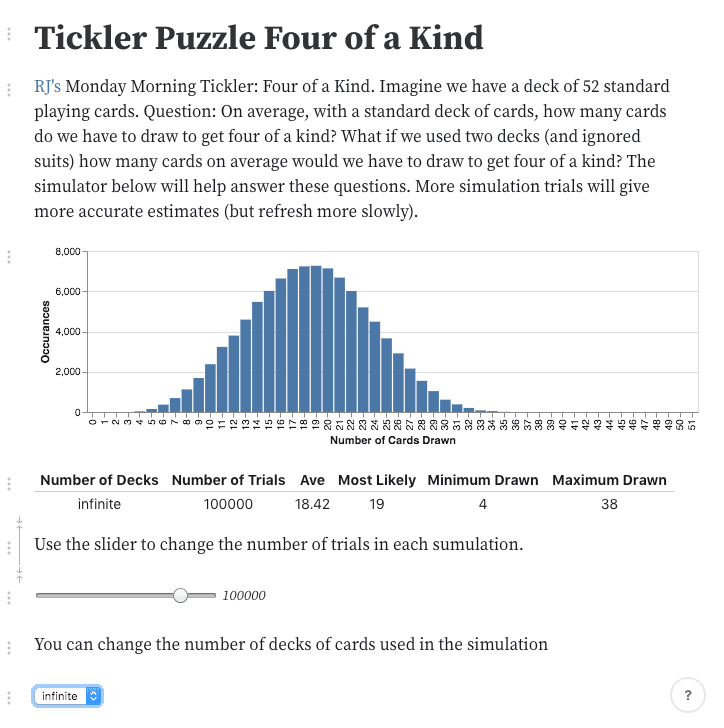
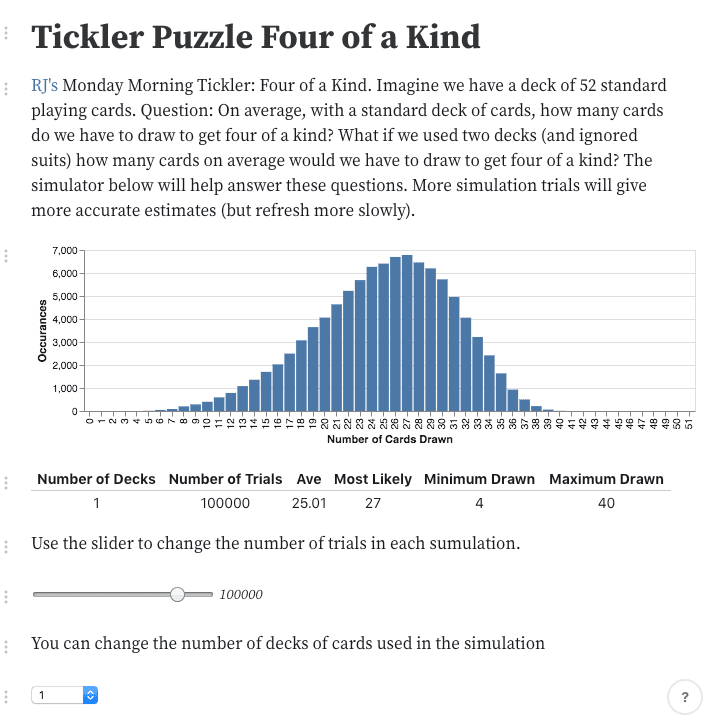
I like coding, I really do. I am retired and I code for fun. I also like learning about new languages, frameworks, and visualization tools. Coding is much more fun in software artist mode, than it is in software engineering mode. The difference is an artist codes what he wants to code whereas an engineer codes what someone else thinks they want. This is a story about my experience exploring Observable "The magic notebook for exploring data and thinking with code." It all started Monday morning when, like I have every Monday morning for the last 10 years, I opened the "Monday Morning Tickler" puzzle email from my good friend RJ Mical. RJ was instrumental in the development of the Amiga, the Atari Lynx, and the 3DO Machine. He is currently director of Games at Google. (Note to self: write a software-artist tribute blog post about RJ). Here was the Tickler Puzzle for January, 20th.
Today's Monday Morning Tickler: Four of a Kind

Imagine we have a deck of 52 standard playing cards.

First question:  How many cards do we have to draw until we can be sure
that we have four of a kind?  In other words:  What is the minimum
number of cards we must draw until we can be certain that four of those
cards are the same kind?

Second question:  What if we started from a tall stack made of TWO decks
of 52 standard playing cards.  How many cards do we have to draw from
this stack until we can be sure that we have four of a kind, where it's
OK to have two of a kind from the same suit?

Third question:  On average, with a standard deck of cards, how many
cards do we have to draw to get four of a kind?
The first two questions were easy, but the statistics knowledge necessary to answer the third question had left my brain many decades ago, if it was indeed ever there. I knew it would be relatively easy to simulate this in code so I decided to do this. The first question was what language, and what platform. Since I thought I might want to share my simulations with others, the obvious choice for platform is the browser, which made JavaScript or ES6 as the choice for language.
I had recently heard about Observable, the magic notebook for exploring data and thinking with code. Observable was created by, and the company founded by Mike Bostock. Here is Mike's short bio from his Observable account: Building a better computational medium. Founder @observablehq. Creator @d3. Former @nytgraphics. Pronounced BOSS-tock. I have used d3.js in the past and found it beautifully elegant. One of Maynard's laws about programming is:
Most truly elegant software systems have a single visionary software artist at their core
Teams are great at software engineering, visionaries create software art. Some examples include: Mike Bostock with d3 and Observable, Guido van Rossum with Python, John McCarthy with LISP, Niklaus Wirth with Pascal, Bill Atkinson with HyperCard, and Bill Duvall with ugh (uncommonly good hack), an implementation of Engelbart's NLS text editor on the Xerox ALTO with mouse and keyset.
Another of Maynard's laws about programming is:
To learn a new language or system you must choose a suitable problem and use the environment to implement, test, and debug the problem.
RJ's four of a kind question provided the a great vehicle for learning Observable. In Observable this means creating an interactive page called a notebook which solves the problem and provides both a UI and live code which the viewer can see and even modify. I started on Monday afternoon, and by Tuesday evening I had a working notebook which you see and interact with here.
When you go to the notebook check the Replace card to deck after drawing it checkbox and instantly the chart and html reflect the change.
 When you replace the cars in the deck after drawing the curve becomes a normal distribution, unlike list distribution with replacement.
The slider controls how many iteration of the random simulations are executed before redrawing the chart. Adjusting the slider and watching the charts change gives you a good feel for how sensitive a normal distribution is to the number of samples included. I customized the slider to be logarithmic. Each move to the left or right divides or multiples the number of sample by 10.
Using Observable is a joy. However, it was not so at first. Let me tell you a story of one day of hell and one of joy implementing this notebook. I started this project on Monday afternoon by reading the introduction to Observable and looking at a few of the really cool examples, especially the animations. My first mistake was being way too ambitious. I thought I would have the bar chart animate in real time at 60 hertz as more iterations of the simulations were calculated. So I started hacking this together. After all I thought, Observable is JavaScript code in the cells, and I know JavaScript. How hard can it be? I spent the next couple of hours in programmer hell, not understanding what the hell was going, watching variables (cells actually) having impossible values, the web page freezing, and seeing this pop-up quite often:
 Then I remembered another of Maynard's laws of programming:
Whenever you observe the impossible, one of your assumptions is wrong
So I decided it was time to read the documentation more carefully and I found Observable is not JavaScript notebook which explained a lot, and demonstrated another of Maynard's laws of programming.
Hacking on a system you fundamentally don't understand is both frustrating and fruitless
I was treating Observable like Javascript and creating 'global' cells that I was modifying in another cell that was called as a generator for each animation frame animation. Observable gave me an error, saying that the cell should be immutable, but I found a work-around where you could declare a cell mutable. What I didn't realize was that modifying the cell would start a recalculation of all referencing cells. This of course caused chaos and probably stack overflows in the depth of the JavaScript v8 runtime. I must say that Observable handled the errors pretty gracefully, but it was still very frustrating for me since I didn't understand what was going on. Once I understood how Observable works things went very smoothly and coding became a joy. Observable is ideally suited for visualizing immutable data, passed through a whole data flow of cells each of which creates its own immutable data as output, with the final stage creating a web page of the visualization. After looking at more examples, creating the visualization of the four-of-a-kind was both easy and fun. Being able to see and edit live code on a web page and see results is magical. Why is this? One of the most brilliant programmers I have ever met, Jim Nitchals had a unique way of estimating the time required to complete a software project. Jim said "Show me a similar program in the proposed software development environment". He would then take out a stopwatch and time the edit-compile-debug loop. Jim then said "All projects take 10,000 builds, and he would multiply the timed result by 10,000". His estimates were much better than most. In Observable this time is measured in seconds which makes the environment both productive and fun. Here is an example. I wanted the user to be able to adjust number of iterations of the simulation to run before charting the results. The first iteration was trivial, a cell like this:
nSamples=100000The user could edit this cell, type in a new number, and then hit Shift+Return and the simulation would rerun with the new number of samples and the chart would redraw. Effective, but had a couple of problems. Too much knowledge and effort required by the user, and too easy to input numbers so large that they would freeze the web page. So I discovered the Observable function valueof which allows one to define a cell whose value comes from an html form. So I found and copied a slider cell which the user could use to vary the number of sample from 1 to one million. I copied and pasted the code, hit Shift+Return and had an instant UI for this. However while playing with the result I found that one really wants a logarithmic scale for the number of samples, not a linear scale. So I edited the slider code as follows:
viewof nSamples = {
  const form = html`<form>
  <input name=i type=range min=0 max=6 value=5 step=1 style="width:180px;">
  <output style="font-size:smaller;font-style:oblique;" name=o></output>
</form>`;
  form.i.oninput = () => {
    form.o.value = Math.pow(10,Math.floor(form.i.valueAsNumber));
    form.value = Math.pow(10,Math.floor(form.i.valueAsNumber)) ;
  };
  form.i.oninput();
  return form;
}
This is all it takes in Observable. Anytime the user adjusts the slider, the nSamples cell in the notebook is multiplied or divided by ten and then Observabl recomputes all of the cells that reference nSamples. Pretty cool. Not only that, but this code is live! Click on the three dots in the margin to the left of the slider and select Edit. A new paragraph opens up showing the code, and with a built in text editor. Try making the following changes to the code:
 viewof nSamples = {
   const form = html`<form>
-  <input name=i type=range min=0 max=6 value=5 step=1 style="width:180px;">
+  <input name=i type=range min=0 max=12 value=5 step=1 style="width:180px;">
   <output style="font-size:smaller;font-style:oblique;" name=o></output>
 </form>`;
   form.i.oninput = () => {
-   form.o.value = Math.pow(10,Math.floor(form.i.valueAsNumber));
-   form.value = Math.pow(10,Math.floor(form.i.valueAsNumber)) ;
+   form.o.value = Math.pow(Math.E,Math.floor(form.i.valueAsNumber));
+   form.value = Math.pow(Math.E,Math.floor(form.i.valueAsNumber)) ;
  };
  form.i.oninput();
  return form;
}
Now hit Shift+Return or click the > button in the upper right of the editor window and instantly your slider now uses natural logs instead of powers of ten. This gives finer control over the number of samples, but doesn't yield nice round numbers. There, you just live edited your first visualization web page! Pretty amazing. You can also import javascript libraries and cells from other notebooks. for example this page uses the wonderful Vega-Lite charting package. Here is the entire code needed to chart the results.
vegalite = require("@observablehq/vega-lite")

vegalite({
  data: { values: results.data },
  mark: "bar",
  autosize: "fit",
  width: width,
  encoding: {
    x: {
      field: "Cards_Drawn",
      type: "ordinal",
      axis: {"title": "Number of Cards Drawn"}
    },
    y: {
      field: "Occurances"
    }
  }
})
Interacting with the simulation in this manner also gave me new insights into the problem. For example, even though on average it takes drawing 25 cards to make four of a kind, the most likely outcome is drawing 27 cards (closely followed by the outcome of drawing 26 cards) Combine this with the fact that you can publish notebooks to share on the web and organize notebooks and collaborate on notebooks makes Observable a really interesting platform for data analysis and visualization. I believe there is a monthly subscription fee of $9 per editor but viewers are free. However there seems to a free trial and I haven't paid nor been billed so far. It may be that commercial requires a subscription. Check it out. Observable

